
Aggregate
impact value is measure of toughness of aggregate. Toughness is the property of
material which indicate its capacity which impact in sudden. Tougher the
aggregate more suitable for wearing surface such as road surface. Lower the
impact value stronger the aggregate, again the impact these for good quality
concrete , aggregate with lower AIV (Aggregate Impact Value) is prepared. AIV
should not be exceed 30 % for concrete used for wearing surface such as road
work or runways or airport. AIV should not be exceed 45 % for concrete used for
any non-wearing concrete work such as beam, slab, column etc.
AIM:
To determine the aggregate impact value of coarse aggregate.
Apparatus:
- Aggregate Impact Value Testing
Machine.
- Sieves (12.5mm,10mm)
- Cylindrical metal measure
(internal diameter 75 mm and depth 50 mm)
- Tamping Rod (10 mm in diameter and 230 mm long, rounded at one end.)
- Balance.
- Oven(3000c)
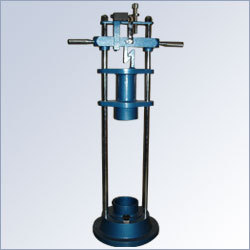
FIGURE:
Procedure:
(i) Sieve the material through 12.5 mm
and 10.0mm IS sieves. The aggregates passing through 12.5mm sieve and retained
on 10.0mm sieve comprises the test material.
(ii)
Pour the aggregates to fill about just 1/3 rd depth of measuring cylinder.
(iii)
Compact the material by giving 25 gentle blows with the rounded end of the
tamping rod.
(iv)
Add two more layers in similar manner, so that cylinder is full.
(v)
Strike off the surplus aggregates.
(vi)
Determine the net weight of the aggregates to the nearest gram(W).
(vii)
Bring the impact machine to rest without wedging or packing up on the level
plate, block or floor, so that it is rigid and the hammer guide columns are
vertical.
(viii)
Fix the cup firmly in position on the base of machine and place whole of the
test sample in it and compact by giving 25 gentle strokes with tamping rod.
(ix) Raise the hammer until its lower
face is 380 mm above the surface of aggregate sample in the cup and allow it to
fall freely on the aggregate sample. Give 15 such blows at an interval of not
less than one second between successive falls.
(x)
Remove the crushed aggregate from the cup and sieve it through 2.36 mm IS
sieves until no further significant amount passes in one minute. Weigh the
fraction passing the sieve to an accuracy of 1 gm. Also, weigh the fraction
retained in the sieve.
Compute
the aggregate impact value. The mean of two observations, rounded to nearest
whole number is reported as the Aggregate Impact Value.
OBSERVATIONS:
Observations
|
Sample 1
|
Sample 2
|
Total weight of dry sample (W1 gm)
|
||
Weight of portion passing 2.36 mm sieve (W2 gm)
|
||
Aggregate Impact Value (percent) = W2 / W1 X 100
|
Result of Impact Test
Aggregate Impact
Value =
Recommended Aggregate Impact Test Values
Classification of
aggregates using Aggregate Impact Value is as given below:
Aggregate Impact Value
|
Classification
|
<20%
|
Exceptionally Strong
|
10 – 20%
|
Strong
|
20-30%
|
Satisfactory for road surfacing
|
>35%
|
Weak for road surfacing
|
Specified limits of percent aggregate impact value for
different types of road construction by Indian Roads Congress is given below.
Sr. No.
|
Type of pavement
|
Aggregate impact value not
more than
|
1.
|
Wearing Course
|
30
|
a) Bituminous surface dressing
|
||
b) Penetration macadam
|
||
c) Bituminous carpet concrete
|
||
d) Cement concrete
|
||
2.
|
Bitumen bound macadam base course
|
35
|
3.
|
WBM base course with bitumen surfacing
|
40
|
4
|
Cement concrete base course
|
45
|


